• Contact
  • About Me
  • Privacy Policy
DefenceDev
  • Home
  • Blog
  • Linux Tutorials
    • Bash Scripting Lessons
    • Commands
    • Networking
  • Solutions
    • Docker
  • Network Tutorials
    • FortiGate
    • MikroTik
  • Projects
    • AdGuard
    • Immich
    • Nextcloud
    • WordPress
  • Cloud
  • Video Tutorials
    • YouTube Channel
    • MikroTik Videos
No Result
View All Result
DefenceDev
No Result
View All Result
ADVERTISEMENT
Home Network Tutorials FortiGate

Fortinet FortiGate: Network Monitoring with Custom Dashboards

neo by neo
May 27, 2025
in FortiGate
0
Fortinet FortiGate: Network Monitoring with Custom Dashboards

Fortinet FortiGate: Network Monitoring with Custom Dashboards

0
SHARES
81
VIEWS
Share on FacebookShare on Twitter
ADVERTISEMENT

Network Monitoring

FortiGate Network Monitoring with Custom Dashboards is the way to have effective network monitoring. It is essential for maintaining the performance and security of your infrastructure. Fortinet FortiGate firewalls provide robust tools for creating custom dashboards that offer real-time insights into traffic patterns, resource utilization, and security events.

Introduction

In this article, we’ll walk through the configuration of a custom FortiGate dashboard designed for monitoring essential metrics like CPU and memory usage, session rates, and traffic distribution. We’ll also take a look at FortiView widgets, which help visualize data on traffic sources, destinations, and bandwidth consumption in real time.

FortiGate firewalls offer a powerful set of features to help administrators monitor and manage network activity in real time. One of the most useful tools within FortiGate is the ability to create custom dashboards, which provide visual insights into various aspects of network performance, security, and usage.

More about FortiGate Dasbhoards and Monitors you can find at the link.

Custom FortiGate Dashboard My Example

FortiGate allows administrators to create highly customizable dashboards by adding widgets. These widgets present key information in an easily digestible format, providing quick insights into network activity.

Below is a step-by-step guide to configuring a useful FortiGate dashboard, highlighting key metrics that are valuable for efficient network monitoring.

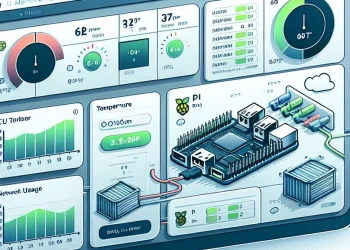
Example of Custom Dashboard for Network Monitoring

FortiGate Network Monitoring
Dashboard
FortiGate Network Monitoring
FortiGate Dashboard Part 2
FortiGate Network Monitoring
FortiGate Dashboard Part 3

Key Dashboard Widgets and Their Functions

Here are the widgets and their functions:
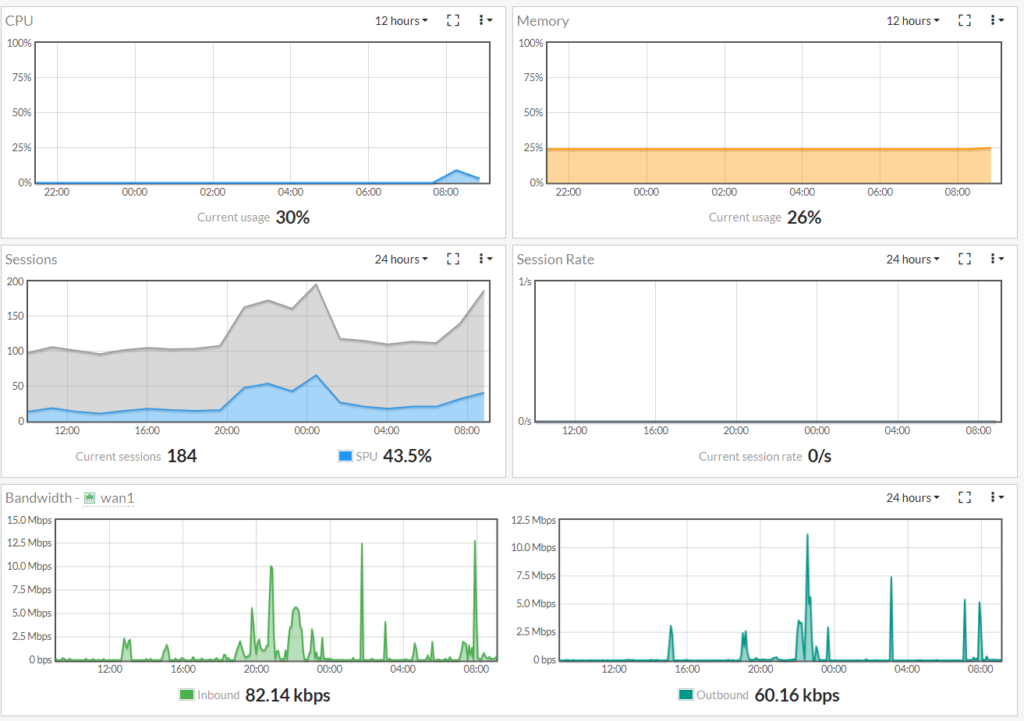
  1. CPU Usage Widget
    This widget displays real-time CPU utilization, allowing administrators to monitor system load.
  2. Memory Usage Widget
    Monitoring memory consumption helps track how much system memory is being used. This is important for identifying potential bottlenecks or resource exhaustion.
  3. Session Rate Widget
    Tracking the session rate is essential for understanding how many active sessions the firewall is handling, a critical factor for performance optimization.
  4. Sessions Widget
    This widget displays the total number of active sessions, giving insights into the current load on the firewall.
  5. Traffic History Widgets
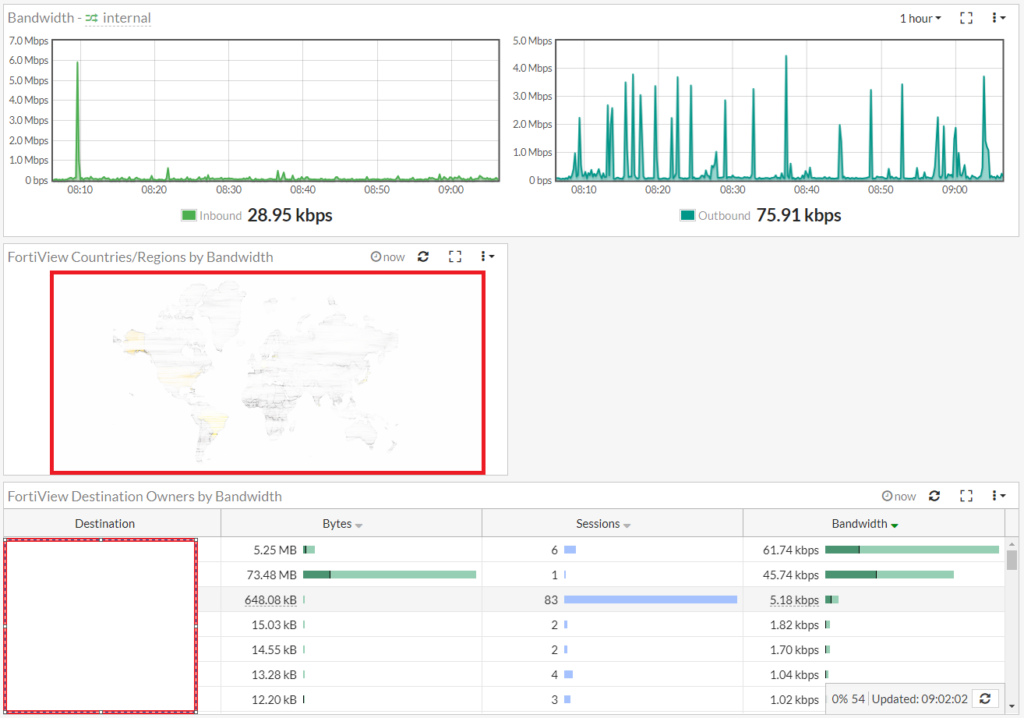
    The traffic history widgets track bandwidth usage on specific interfaces (e.g., internal and wan1). These are particularly useful for analyzing traffic patterns and detecting anomalies.
  6. FortiView Widgets
    FortiView provides detailed traffic analysis:
    • By Country: Displays traffic source or destination countries, sorted by bandwidth usage.
    • By Owner: Shows bandwidth usage by specific user owners in real time.
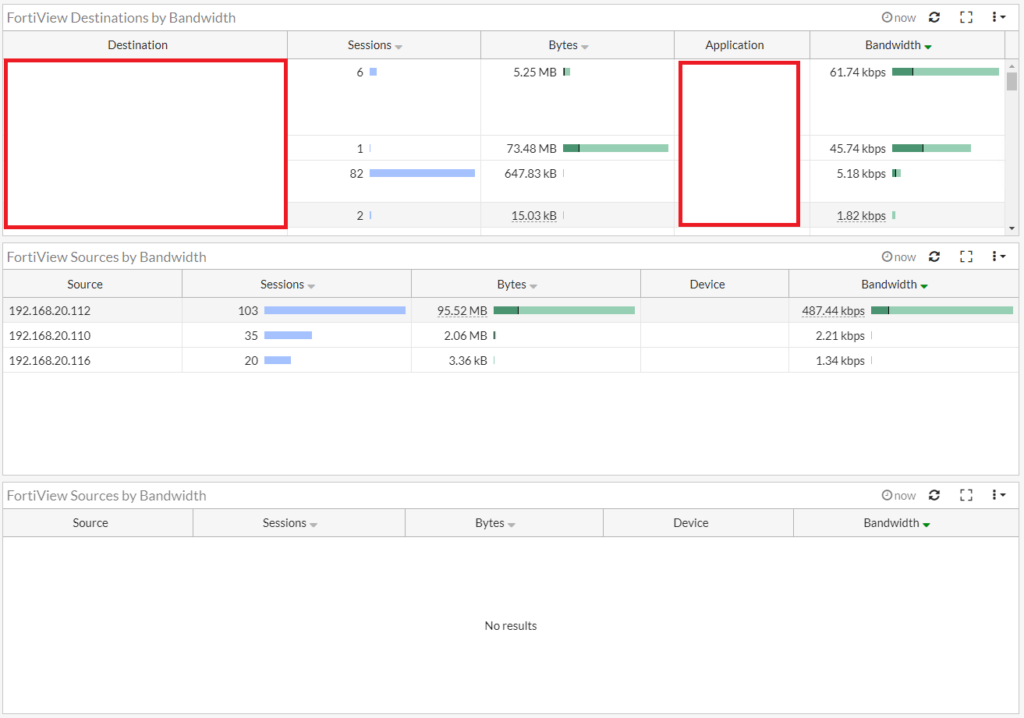
    • By Destination: Lists destination IPs or domains consuming the most bandwidth.
    • By Source: Displays the top source IPs contributing to the network load.
    • By WAN Source: Tracks sources sending traffic through the WAN interface.

Create a new Dasbhoard

Steps With the Web Interface

Access the FortiGate Web Interface

  • Open a web browser and enter the IP address of your FortiGate device.
  • Login using your admin credentials.

Step 2: Navigate to Dashboard > Main

Add New Dashboard
Add New Dashboard

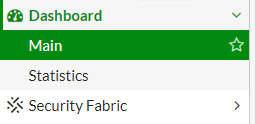
Open a main Dashboard to start Dasbhoard creation process.

ADVERTISEMENT

At the right corner click at the Add Dashboard

Add New Dashboard
Add New Dashboard

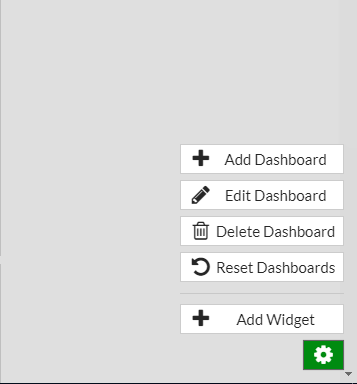
In the top-right corner, you’ll find the option to create a new Dashboard.

Add Dashboard
Add Dashboard

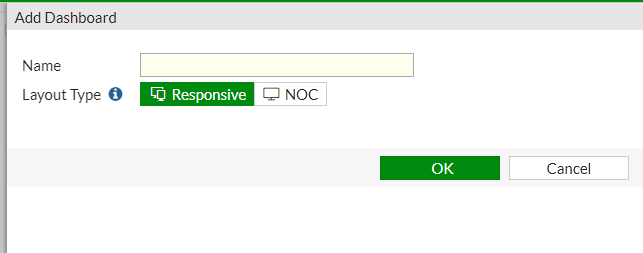
New window will open where you can enter the name of the new Dashboards. In my case name is “Statistics”,

Select created Dashboard and add on the same way Widgets

Dashboard Statistics
New Dashboard Statistics

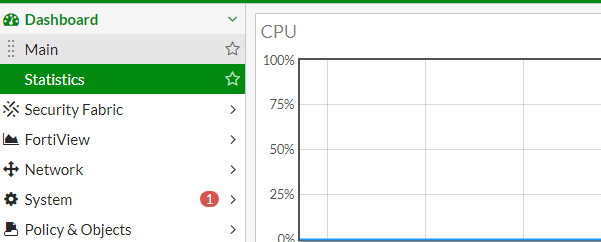
The new dashboard will appear and you can select it.

Add new Dashboard Widget

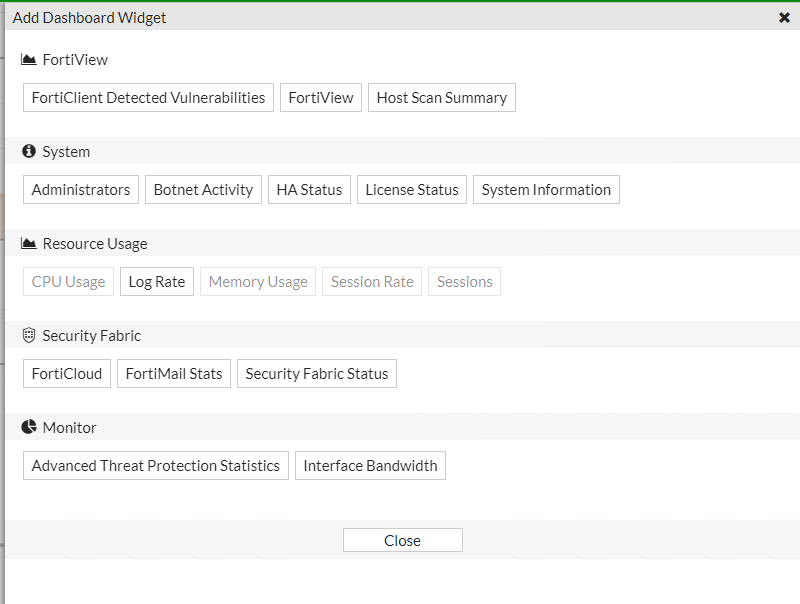
In the top-right corner, you’ll find the option to add a new Widget. In my case I added CPU Usage, Memory Usage and various statistics about interfaces.

ADVERTISEMENT

This dashboard has lot of information about the state of the network. It is possible to change the scope from 5 minutes to 24 hours.

CLI Configuration for My Setup

You can copy the following configuration for dashboard in your configuration

ADVERTISEMENT
config system admin
    edit "cyberworld"
        set accprofile "super_admin"
        set vdom "root"
        config gui-dashboard
            edit 1
                set name "Main"
                config widget
                    edit 1
                        set width 2
                        set height 1
                    next
                    edit 5
                        set type admins
                        set x-pos 1
                        set width 1
                        set height 1
                    next
                    edit 6
                        set type cpu-usage
                        set x-pos 3
                        set width 2
                        set height 1
                    next
                    edit 7
                        set type memory-usage
                        set x-pos 2
                        set width 2
                        set height 1
                    next
                    edit 8
                        set type sessions
                        set x-pos 4
                        set width 2
                        set height 1
                    next
                end
            next
            edit 2
                set name "Statistics"
                config widget
                    edit 1
                        set type cpu-usage
                        set width 2
                        set height 1
                    next
                    edit 3
                        set type memory-usage
                        set x-pos 1
                        set width 2
                        set height 1
                    next
                    edit 4
                        set type session-rate
                        set x-pos 3
                        set width 2
                        set height 1
                    next
                    edit 5
                        set type sessions
                        set x-pos 2
                        set width 2
                        set height 1
                    next
                    edit 6
                        set type tr-history
                        set x-pos 5
                        set width 4
                        set height 1
                        set interface "internal"
                    next
                    edit 7
                        set type tr-history
                        set x-pos 4
                        set width 4
                        set height 1
                        set interface "wan1"
                    next
                    edit 9
                        set type fortiview
                        set x-pos 6
                        set width 2
                        set height 1
                        set fortiview-type "country"
                        set fortiview-sort-by "bandwidth"
                        set fortiview-timeframe "realtime"
                        set fortiview-visualization "country"
                    next
                    edit 2
                        set type fortiview
                        set x-pos 7
                        set width 4
                        set height 1
                        set fortiview-type "owner"
                        set fortiview-sort-by "bandwidth"
                        set fortiview-timeframe "realtime"
                        set fortiview-visualization "table"
                    next
                    edit 8
                        set type fortiview
                        set x-pos 8
                        set width 4
                        set height 1
                        set fortiview-type "destination"
                        set fortiview-sort-by "bandwidth"
                        set fortiview-timeframe "realtime"
                        set fortiview-visualization "table"
                    next
                    edit 11
                        set type fortiview
                        set x-pos 9
                        set width 4
                        set height 1
                        set fortiview-type "source"
                        set fortiview-sort-by "bandwidth"
                        set fortiview-timeframe "realtime"
                        set fortiview-visualization "table"
                    next
                    edit 10
                        set type fortiview
                        set x-pos 10
                        set width 4
                        set height 1
                        set fortiview-type "wanSource"
                        set fortiview-sort-by "bandwidth"
                        set fortiview-timeframe "realtime"
                        set fortiview-visualization "table"
                    next
                end
            next
        end

If you are interested in QoS, Traffic Shapres and Bandwidth Limitation check the link.

defencedev.com

About The Author

neo

See author's posts

Tags: fortigate
ADVERTISEMENT
Previous Post

Fortinet FortiGate: DNS Server Configuration

Next Post

MikroTik: Schedule Automatic Reboot Every 7 Days

neo

neo

Next Post
MikroTik: Schedule Automatic Reboot Every 7 Days

MikroTik: Schedule Automatic Reboot Every 7 Days

Follow Us

  • Trending
  • Comments
  • Latest
MikroTik: Export Configuration in Text File

MikroTik: Export Configuration in Text File

Fortinet FortiGate: Static Route Configuration via GUI and CLI

Fortinet FortiGate: Static Route Configuration via GUI and CLI

Immich: Installation on Ubuntu 22.04

Immich: Installation on Ubuntu 22.04

Fortinet FortiGate Upgrade Path Tool

Fortinet FortiGate Upgrade Path Tool

NextCloud: Port Forwarding - Essential Ports for Smooth Functionality

NextCloud: Port Forwarding – Essential Ports for Smooth Functionality and Remote Access

Organizing and Managing Photos with Immich: Features I Use

Organizing and Managing Photos with Immich: Features I Use

Install Ubuntu 22.04 on Oracle VM Virtual Box

Install Ubuntu 22.04 on Oracle VM Virtual Box

Linux Directories: cd (Change Directory), pwd (Print Working Directory), mkdir (Make Directory)

Linux Directories: cd (Change Directory), pwd (Print Working Directory), mkdir (Make Directory)

Raspberry Pi Monitoring with Monit: Docker, Temperature, Network & More

Raspberry Pi Monitoring with Monit: Docker, Temperature & More

Install WordPress on Raspberry Pi 4 with Docker (Ubuntu 22.04)

Install WordPress on Raspberry Pi 4 with Docker (Ubuntu 22.04)

Install Nextcloud on Raspberry Pi 4 with Docker (Ubuntu 22.04)

Install Nextcloud on Raspberry Pi 4 with Docker (Ubuntu 22.04)

Install Nginx Proxy Manager on Raspberry Pi 4 with Docker (Ubuntu 22.04)

Install Nginx Proxy Manager on Raspberry Pi 4 with Docker (Ubuntu 22.04)

Recent News

Raspberry Pi Monitoring with Monit: Docker, Temperature, Network & More

Raspberry Pi Monitoring with Monit: Docker, Temperature & More

Install WordPress on Raspberry Pi 4 with Docker (Ubuntu 22.04)

Install WordPress on Raspberry Pi 4 with Docker (Ubuntu 22.04)

Install Nextcloud on Raspberry Pi 4 with Docker (Ubuntu 22.04)

Install Nextcloud on Raspberry Pi 4 with Docker (Ubuntu 22.04)

Install Nginx Proxy Manager on Raspberry Pi 4 with Docker (Ubuntu 22.04)

Install Nginx Proxy Manager on Raspberry Pi 4 with Docker (Ubuntu 22.04)

Install Docker on Raspberry Pi 4 with Ubuntu 22.04

Install Docker on Raspberry Pi 4 with Ubuntu 22.04

ADVERTISEMENT

DefenceDev Tutorials

defencedev Logo

Whether you’re just starting or looking to expand your skills, I hope you find useful information and engaging discussions here. Let me take you through my journey and the goals behind this space!

Follow Us

Browse by Category

  • Blog
  • Cloud
    • Private
  • Linux Tutorials
    • Bash Scripting Tutorials
    • Commands
    • Networking
  • Network Tutorials
    • FortiGate
    • MikroTik
  • Projects
    • AdGuard
    • Immich
    • Nextcloud
    • WordPress
  • Solutions
    • Docker
  • Video Tutorials
    • MikroTik Videos

Recent News

Raspberry Pi Monitoring with Monit: Docker, Temperature, Network & More

Raspberry Pi Monitoring with Monit: Docker, Temperature & More

Install WordPress on Raspberry Pi 4 with Docker (Ubuntu 22.04)

Install WordPress on Raspberry Pi 4 with Docker (Ubuntu 22.04)

  • Site Map
  • Privacy Policy
  • Facebook Page
  • Disclaimer
  • Contact
  • About Me

© 2025 defencedev.com - All rights reserved.

No Result
View All Result
  • Home
  • Blog
  • Linux Tutorials
    • Bash Scripting Lessons
    • Commands
    • Networking
  • Solutions
    • Docker
  • Network Tutorials
    • FortiGate
    • MikroTik
  • Projects
    • AdGuard
    • Immich
    • Nextcloud
    • WordPress
  • Cloud
  • Video Tutorials
    • YouTube Channel
    • MikroTik Videos

© 2025 defencedev.com - All rights reserved.