
Monitoring Linux Server and Applications with Monit
Configure Linux System and Immich SNAP Application Monitoring with Monit (or any other application) is crucial for ensuring stability and reliability. In this guide, we will configure Monit to monitor the Immich SNAP application, tracking key system metrics such as CPU, RAM, and disk usage. Additionally, we will set up Monit to check whether the immich-distribution process is running and ensure that the application remains accessible. By implementing these monitoring rules, administrators can detect potential issues early and prevent service disruptions.
In case that you are interested in Monit monitporing Application please check how to install it in my post: Linux Performance Monitoring with Monit Application. In this article we will go more through specific example.
Why I choose Monit for Linux Server Monitoring?
I chose Monit because it’s super easy to install and configure, making it perfect for keeping an eye on my server without spending hours setting things up. I also love that I can access its dashboard from anywhere, so even if I’m away from home, I can quickly check the status of my system. Another big plus is the alerting feature—I don’t have to constantly monitor things manually because Monit will notify me if something goes wrong. It also does a great job at checking if my applications and services are running, so if something crashes, I’ll know right away and can fix it before it becomes a bigger problem. Overall, it’s a simple but powerful tool that gives me peace of mind!
How My Monit Dashboard Helps Me Monitor My Linux Server
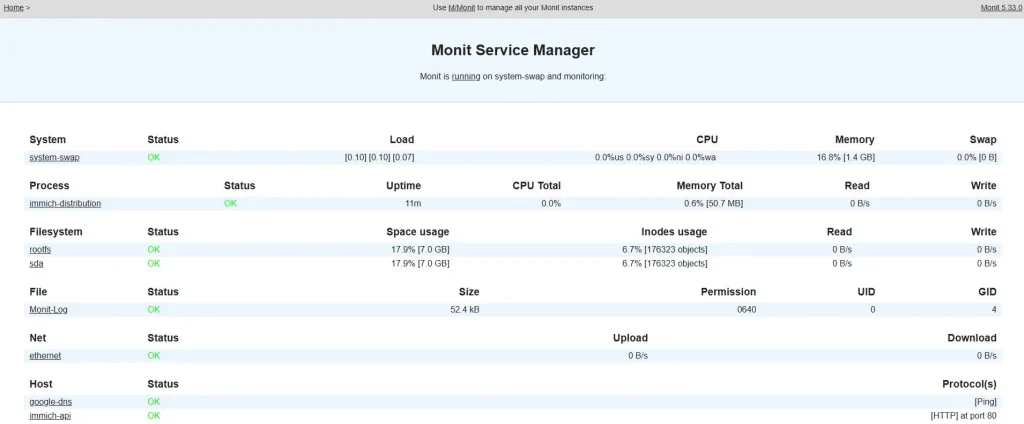
With Monit, I have a simple and effective way to keep track of my server’s health and performance. The dashboard provides a real-time overview of essential system metrics, allowing me to quickly check if everything is running smoothly.
One of the most useful features is the resource monitoring section, where I can see CPU, RAM, and disk usage at a glance. If CPU or memory usage goes above 80%, it is highlighted, making it easy to detect potential performance issues before they impact my applications. The disk usage section helps me stay aware of available storage space, ensuring that my server doesn’t run into problems due to a full disk.
In addition to system resources, Monit also monitors the Immich SNAP application (immich-distribution). If the application stops running for any reason, Monit will immediately send an alert, so I don’t have to constantly check it myself. This feature is crucial since I use my server for personal tasks and family storage, and I can’t be on my PC every day to manually monitor everything.
Which Metrics I Choose for my Linux Servers
- CPU Usage
- RAM Usage
- Disk Usage
- Application Process Monitoring
- In this example it is a Immich
- Network Connectivity check – ping check
- Port Monitoring (Service Availability Check)
- Disk I/O Monitoring (Read/Write Performance Check)
- System Uptime Monitoring
- System Load Monitoring
- Swap Usage Monitoring
1. CPU Usage Monitoring
Monitoring CPU usage ensures that the system is not overwhelmed by excessive processing demands. If CPU usage exceeds 80% for a prolonged period, it may indicate high application load, inefficient processes, or a potential performance bottleneck. Monit can send alerts when this threshold is exceeded, allowing administrators to take corrective actions such as optimizing processes, checking for resource-heavy applications, or scaling system resources.
# Monitor CPU usage
check system system-cpu
    if cpu usage > 80% for 2 cycles then alert
✅ Benefit: Monitoring CPU usage helps ensure the system isn’t overloaded, allowing early detection of performance bottlenecks and preventing resource exhaustion.
2. RAM Usage Monitoring
Keeping track of memory (RAM) usage is crucial to prevent system slowdowns or crashes due to resource exhaustion. If RAM usage exceeds 80%, it might indicate memory leaks, too many active processes, or improper resource allocation. Monit provides timely notifications when memory usage reaches a critical level, helping administrators diagnose and optimize resource utilization before performance degrades.
# Monitor RAM usage
check system system-ram
    if memory usage > 80% for 2 cycles then alert
✅ Benefit: Tracking RAM usage prevents system slowdowns and crashes by identifying excessive memory consumption, ensuring optimal resource allocation and performance.
3. Disk Usage Monitoring
Disk space monitoring is essential for maintaining system stability and preventing service interruptions. If disk usage surpasses 80%, the system may run out of storage, leading to failed application writes, logging failures, or database corruption. By monitoring disk usage, administrators can proactively clean up unnecessary files, expand storage, or allocate disk space more efficiently before issues arise.
# Monitor Disk Usage (Root partition)
check filesystem rootfs with path /
    if space usage > 80% for 2 cycles then alert
✅ Benefit: Monitoring disk usage ensures there’s sufficient storage available, preventing data loss and system failures due to full disks or mismanaged storage.
4. Application Process Monitoring
Ensuring that the Immich SNAP application is continuously running is critical for providing uninterrupted service. Monit checks whether the immich-distribution process is active, and if it stops unexpectedly, it can trigger an alert or even restart the process automatically. This feature minimizes downtime and ensures that the application remains available for users.
# Monitor Immich Application (Snap Service)
check process immich-distribution
    matching "immich-distribution"
    start program = "/usr/bin/snap start immich-distribution"
    stop program = "/usr/bin/snap stop immich-distribution"
    if does not exist for 2 cycles then alert
✅ Benefit: In case that application is not running for 2 check cycles admin will get alert.
5. Network Connectivity Monitoring (Ping Check)
Monitoring network connectivity helps identify external connection issues or network failures. By pinging an external service such as Google DNS (8.8.8.8), Monit can detect if the server has lost internet access. This is particularly useful for remote servers or applications that rely on external APIs and cloud services. If a ping fails, an alert is sent, allowing quick diagnosis and troubleshooting of network outages.
check host google-dns with address 8.8.8.8
    if failed ping then alert
✅ Benefit: Alerts you if the server loses internet connectivity.
6. Port Monitoring (Service Availability Check)
Even if an application process is running, it doesn’t always mean the service is accessible. By monitoring a specific port (e.g., Immich API on port 2283), Monit ensures that the application is responding correctly. If the port becomes unreachable, it could indicate an application crash, firewall misconfiguration, or network issue. This check helps detect and fix service failures before users are affected.
check host immich-api with address 127.0.0.1
    if failed port 2283 protocol HTTP then alert
✅ Benefit: Detects if Immich is running but not responding.
7. Disk I/O Monitoring (Read/Write Performance Check)
High disk read/write activity can lead to performance degradation, especially on servers with heavy workloads. Monitoring disk I/O ensures that excessive data transfers do not impact system performance. If disk activity exceeds a certain threshold (e.g., 100 MB/s), Monit triggers an alert, allowing administrators to investigate potential issues such as disk bottlenecks, high logging activity, or overloaded databases.
Monitor disk read/write performance and detect potential bottlenecks:
check device sda with path /dev/sda
    if read rate > 100 MB/s for 5 cycles then alert
    if write rate > 100 MB/s for 5 cycles then alert
✅ Benefit: Helps in detecting excessive disk activity that may impact performance.
8. System Uptime Monitoring
Unexpected system reboots can lead to data loss, application failures, or system instability. By monitoring uptime, Monit can detect when the system has restarted and send an alert if uptime is below a certain threshold (e.g., 10 minutes). This is useful for identifying unexpected crashes, power failures, or automatic reboots due to software updates.
Detects if the system was restarted unexpectedly:
check system system-uptime
    if uptime < 10 minutes then alert
✅ Benefit: Notifies you if the server reboots unexpectedly.
9. Log File Monitoring (Error Detection)
Log files provide valuable insights into application performance and potential issues. By monitoring the Immich log file (/var/snap/immich/common/logs/immich.log), Monit can scan for specific error messages. If an error is detected, an alert is sent, helping administrators troubleshoot issues in real time before they escalate into major problems.
Check if there are critical errors in logs (e.g., Immich logs).
check file immich-log with path /var/snap/immich/common/logs/immich.log
    if match "ERROR" then alert
✅ Benefit: Detects issues in logs automatically.
10. System Load Monitoring
Monitoring system load helps detect whether the server is under excessive stress. A high system load average (e.g., above 5) might indicate that too many processes are running simultaneously, leading to degraded performance. By setting up Monit to alert when the load exceeds a certain level, administrators can investigate and optimize system performance before it becomes unresponsive.
Detect if the system is overloaded:
check system system-load
    if loadavg (1min) > 5 then alert
✅ Benefit: Helps prevent performance degradation by monitoring system load.
11. Swap Usage Monitoring
When a system runs out of RAM, it uses swap space as virtual memory. High swap usage can significantly slow down performance since accessing disk-based swap is much slower than using RAM. If swap usage exceeds 70%, Monit can send an alert, prompting administrators to check memory-hungry processes and optimize resource allocation to prevent slowdowns.
Detect if the system is running out of swap memory:
check system system-swap
    if swap usage > 70% then alert
Complete Configuration File
Configuration file is stored under: /etc/monit/monitrc
###############################################################################
## Monit control file
###############################################################################
##
## Comments begin with a '#' and extend through the end of the line. Keywords
## are case insensitive. All path's MUST BE FULLY QUALIFIED, starting with '/'.
##
## Below you will find examples of some frequently used statements. For
## information about the control file and a complete list of statements and
## options, please have a look in the Monit manual.
##
##
###############################################################################
## Global section
###############################################################################
set httpd
    port 2812 # set port for the application
    #use address 0.0.0.0/0.0.0.0  # only accept connection from localhost
    allow 0.0.0.0/0.0.0.0
    allow youruser:yourpassword # set user and password

##
## Start Monit in the background (run as a daemon):
#
set daemon  30             # check services at 30 seconds intervals
#   with start delay 240    # optional: delay the first check by 4-minutes (by
#                           # default Monit check immediately after Monit start)
#
#
## Set syslog logging. If you want to log to a standalone log file instead,
## specify the full path to the log file
#
set log /var/log/monit.log

 set eventqueue
     basedir /var/lib/monit/events  # set the base directory where events will be stored
     slots 100                      # optionally limit the queue size

  check network ethernet with interface enp0s3
    if link down then alert
    if changed link then alert
    if saturation > 90% then alert
    if download > 10 MB/s then alert
    if total uploaded > 1 GB in last hour then alert

###############################################################################
## Includes
###############################################################################
##
## It is possible to include additional configuration parts from other files or
## directories.
#
#  include /etc/monit.d/*
include /etc/monit/conf.d/*
include /etc/monit/conf-enabled/*
#

#Added part
# Monitor Immich Application (Snap Service)
check process immich-distribution
    matching "immich-distribution"
    start program = "/usr/bin/snap start immich-distribution"
    stop program = "/usr/bin/snap stop immich-distribution"
    if does not exist for 2 cycles then alert

# Monitor Disk Usage (Root partition)
check filesystem rootfs with path /
    if space usage > 80% for 2 cycles then alert

# Monitor RAM usage
check system system-ram
    if memory usage > 80% for 2 cycles then alert

# Monitor CPU usage
check system system-cpu
    if cpu usage > 80% for 2 cycles then alert

# Check Internet Connection
check host google-dns with address 8.8.8.8
    if failed ping then alert

# CHeck Immich Web Server
check host immich-api with address 127.0.0.1
    if failed port 80 protocol HTTP then alert

# Check Disk I/O
check device sda with path /dev/sda2
    if read rate > 100 MB/s for 5 cycles then alert
    if write rate > 100 MB/s for 5 cycles then alert

# Check Uptime
check system system-uptime
    if uptime < 10 minutes then alert

# Immich Log file monitoring if needed
check file immich-log with path /var/snap/immich/common/logs/immich.log
    if match "ERROR" then alert

# Monitor System Load
check system system-load
    if loadavg (1min) > 5 then alert

# Monitor Free Swap Space
check system system-swap
    if swap usage > 70% then alert
Conclusion
Monit is a lightweight, easy-to-use, and reliable tool that helps me keep my server running smoothly without constant checks. It monitors system resources and the Immich SNAP application (immich-distribution), sending alerts if anything stops working. This is essential since I use my server for personal and family storage and can’t monitor it daily.


