
I use Monit on my Raspberry Pi to continuously monitor critical Docker services, system health, network status, disk I/O, and temperature. Monitoring is crucial because it helps me detect issues early and avoid bigger problems. With instant alerts, I can respond quickly and keep my system running smoothly.
Raspberry Pi Monitoring with Monit
Running important services on a Raspberry Pi 4 means you need a solid way to monitor the system on you Raspberry Pi device. I use Monit Application to watch over my Raspberry Pi and send me alert emails when something goes wrong — like high temperature, network issues, or a Docker container crash. On the Raspberry itself is Ubuntu 22.04 installed.
Several critical Docker services are running on my Pi, and if any of them fail, I want to know immediately. Below is a list of the containers currently in use.
Monitoring for Docker Services on My Raspberry Pi
| Container Name | Image | Status | Ports Exposed |
|---|---|---|---|
netdata | netdata/netdata:latest | healthy | 19999/tcp |
portainer | portainer/portainer-ce:latest | running | 9000/tcp |
nextcloud | nextcloud | running | 8080->80/tcp |
wordpress-obd-scan | wordpress:latest | running | 80/tcp |
wordpress-obd-scan-db | mariadb:10.5 | running | 3306/tcp |
nginx-proxy-manager | jc21/nginx-proxy-manager:latest | running | 80, 81, 443/tcp |
npm-mariadb | mariadb:10.5 | running | 3306/tcp |
I also have a Monit dashboard enabled for real-time status checks via a web browser.
Monit Dashboard for Raspberry in the Web Browser
In addition to email alerts and CLI tools, Monit provides a simple but powerful web dashboard accessible on port 2812. Once enabled, I can open it in any browser on my local network and instantly check the status of all monitored services.
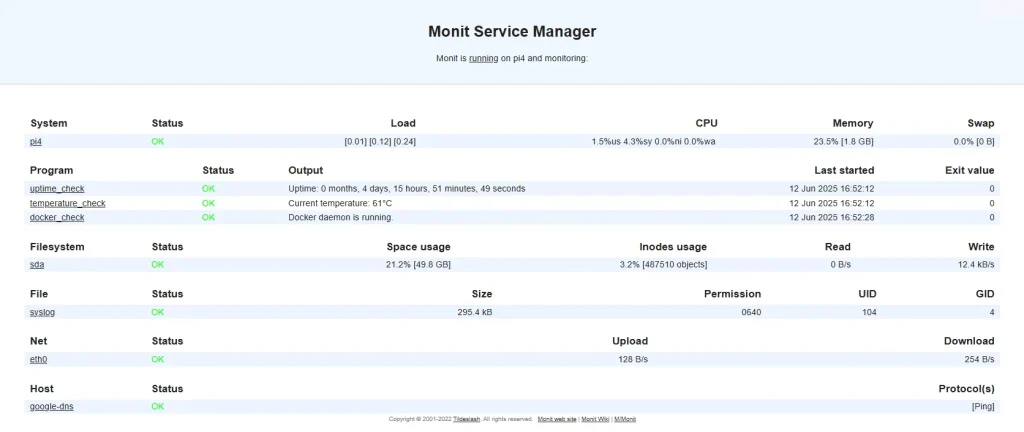
The dashboard shows:
- Current status (OK, Failed, Restarting, etc.)
- CPU load, memory, and uptime
- Health of network interfaces and mounted disks
- Status of my custom checks (Docker health, uptime, temperature)
- Logs of recent events and alerts
This dashboard helps me react quickly without logging into the Pi via SSH. It’s especially useful when I’m not at home and accessing the network remotely through VPN.
Why It Works So Well for Me
My Raspberry Pi 4 runs multiple services in Docker, acts as a small home server, and even hosts a personal WordPress blog. I don’t want to wake up one morning and find that Nextcloud, Portainer, or my proxy manager has been down for hours without me knowing.
With Monit:
- I get email alerts the moment a container fails.
- I can see the system status at a glance from any browser on my network.
- I’ve written a few bash scripts to extend what Monit can monitor (CPU temp, Docker health, uptime).
- I can keep my Pi running stable without babysitting it manually.
It’s a no-brainer for anyone running critical services on a small, self-hosted device.
Monit Configuration Overview
Here is the configuration file I use:/etc/monit/monitrc
set daemon  15
set logfile /var/log/monit.log
set alert admin@mail.com

set httpd
    port 2812
    allow user:password

set mailserver out.mail.com port 587
    username "user@mail.com"
    password "Password"
    using tls
Monit Monitoring Rules on Raspberry Pi with Ubuntu
These monitoring rules are designed to cover all key aspects of my Raspberry Pi’s operation, from system uptime to Docker container health. They provide a comprehensive safety net that alerts me immediately if anything goes wrong, helping to maintain reliability and performance without constant manual checks.
1. Uptime Check on Raspberry Pi Device
To monitor my Raspberry Pi’s uptime and detect unexpected reboots, I use a custom script (check_uptime.sh). Monit executes this script every 30 seconds (2 cycles × 15s). The script checks how long the system has been running and returns a non-zero status if the uptime is below a defined threshold — for example, 5 minutes.
This is especially useful because sometimes the Pi might reboot due to a power issue or thermal reset without me noticing. With this check, I get an instant email alert if the device unexpectedly restarts.
Using a custom script gives me full control over the logic — I can define what counts as “suspicious uptime” and customize the alert behavior.
check program uptime_check with path "/usr/local/bin/check_uptime.sh"
    every 2 cycles
    if status != 0 then alert
Create a script and copy the content of the file:
sudo nano usr/local/bin/check_temp.sh#!/bin/bash
# Extract only the numeric part of temperature (e.g. 55 from +55.3°C)
TEMP=$(sensors | grep 'temp1' | awk '{print $2}' | sed 's/+//' | cut -d. -f1)
# Print temperature to stdout so Monit logs it
echo "Current temperature: ${TEMP}°C"
# Threshold: send alert if temperature >= 75°C
if [ "$TEMP" -ge 65 ]; then
exit 1
else
exit 0
fi
root@pi4:~# ^C
root@pi4:~# more /usr/local/bin/check_uptime.sh
#!/bin/bash
# Get uptime in seconds from /proc/uptime (first field)
UPTIME_SEC=$(cut -d. -f1 /proc/uptime)
# Calculate months, days, hours, minutes, seconds
MONTHS=$(( UPTIME_SEC / 2592000 )) # 30 * 24 * 60 * 60 = 2592000 seconds per month approx.
REMAIN=$(( UPTIME_SEC % 2592000 ))
DAYS=$(( REMAIN / 86400 )) # 24 * 60 * 60 = 86400 seconds per day
REMAIN=$(( REMAIN % 86400 ))
HOURS=$(( REMAIN / 3600 )) # 60 * 60 = 3600 seconds per hour
REMAIN=$(( REMAIN % 3600 ))
MINUTES=$(( REMAIN / 60 ))
SECONDS=$(( REMAIN % 60 ))
# Print uptime in readable format for Monit logs
echo "Uptime: ${MONTHS} months, ${DAYS} days, ${HOURS} hours, ${MINUTES} minutes, ${SECONDS} seconds"
# Alert threshold: uptime less than 10 minutes (600 seconds)
if [ "$UPTIME_SEC" -lt 600 ]; then
exit 1
else
exit 0
fiMake it executable:
chmod +x /usr/local/bin/check_uptime.sh2. Network Interface Monitoring
I monitor my Raspberry Pi’s network interface eth0 to ensure stable connectivity and performance. Monit checks link status, detects any connection failures or changes, and tracks traffic saturation and bandwidth usage. If the link goes down or bandwidth exceeds set thresholds, I receive an immediate alert to quickly address potential network issues.
check network eth0 with interface eth0
    if failed link then alert
    if changed link then alert
    if saturation > 80% then alert
    if download > 10 MB/s then alert
    if upload > 10 MB/s then alert
3. Disk I/O Monitoring
Monitoring disk I/O helps me catch unusual read or write activity that could indicate hardware issues or runaway processes. Monit tracks the data transfer rates on the main disk and alerts me if they exceed safe thresholds over multiple cycles. This proactive check prevents performance bottlenecks and potential data corruption on my Raspberry Pi.
check device sda with path /
    if read rate > 60 MB/s for 5 cycles then alert
    if write rate > 60 MB/s for 5 cycles then alert
4. Connectivity Check
To ensure my Raspberry Pi stays connected to the internet, Monit regularly pings a reliable host—Google’s DNS server at 8.8.8.8. If the ping fails, it triggers an alert, signaling potential network outages or ISP problems. This simple check helps me quickly detect and troubleshoot connectivity issues before they affect my services.
check host google-dns with address 8.8.8.8
    every 2 cycles
    if failed ping then alert
5. CPU Temperature Monitoring
Keeping an eye on the CPU temperature is crucial to prevent overheating and hardware damage on the Raspberry Pi. I use a custom script that Monit runs periodically to check if the temperature exceeds a safe limit. If it does, Monit immediately sends me an alert so I can take action, like improving cooling or shutting down non-essential processes.
Please followe same steps as for step Uptime Check on Raspberry Pi Device.
check program temperature_check with path "/usr/local/bin/check_temp.sh"
    every 20 cycles
    if status != 0 then alert
root@pi4:~# ^C
root@pi4:~# more /usr/local/bin/check_temp.sh
#!/bin/bash
# Extract only the numeric part of temperature (e.g. 55 from +55.3°C)
TEMP=$(sensors | grep 'temp1' | awk '{print $2}' | sed 's/+//' | cut -d. -f1)
# Print temperature to stdout so Monit logs it
echo "Current temperature: ${TEMP}°C"
# Threshold: send alert if temperature >= 75°C
if [ "$TEMP" -ge 65 ]; then
exit 1
else
exit 0
fi6. Docker Health Check
Since my critical services run inside Docker containers, I use a custom script to monitor their health and uptime. Monit runs this script frequently to verify that all important containers are running smoothly and restarts or alerts me if any container stops unexpectedly. This ensures my applications stay online without manual intervention.
Please followe same steps as for step Uptime Check on Raspberry Pi Device.
check program docker_check with path "/usr/local/bin/check_docker.sh"
    if status != 0 then alert
    every 1 cycle
root@pi4:~# more /usr/local/bin/check_docker.sh
#!/bin/bash
DOCKER_BIN="/usr/bin/docker"
if ! pgrep -x "dockerd" > /dev/null; then
echo "Docker daemon is not running!"
exit 1
fi
running_containers=$($DOCKER_BIN ps -q | wc -l)
echo "Docker daemon is running."
echo "Number of running containers: $running_containers"
$DOCKER_BIN ps --format "Container: {{.Names}}, Status: {{.Status}}, Image: {{.Image}}" 2>&1
if [ "$running_containers" -eq 0 ]; then
echo "No containers are currently running."
exit 1
fi
exit 07. Log Monitoring
I monitor system logs for error messages to catch issues early before they escalate. Monit scans the /var/log/syslog file and sends an alert if it detects any lines containing the word “error.” This helps me stay informed about system problems and respond quickly to maintain stability.
check file syslog with path /var/log/syslog
    if match "error" then alert
What This Configuration Does
- Sends alert emails for system and container failures.
- Tracks Docker containers via custom scripts.
- Checks internet connectivity (ping to 8.8.8.8).
- Monitors CPU temperature using a shell script.
- Detects high disk I/O rates.
- Alerts on unusual network activity or link loss.
- Logs are monitored for “error” strings.
- Offers a web dashboard for quick system status checks.
Script for Raspberry Pi4 (with Ubuntu 22.04) Monitoring with Monit
Complete script in one file needs to be stored at the location (maybe file contains something – create backup if needed):
sudo nano /etc/monit/monitrcAdapt the script with your custome values and past it in the file:
set daemon  15
set logfile /var/log/monit.log
set alert admin@mail.com

set httpd
    port 2812
    allow user:strongpassword123   # Replace with your desired username and password

set mailserver out.mail.com port 587
    username "user@mail.com"
    password "securepassword456"   # Replace with your real email password
    using tls

# Check PI4 Uptime
check program uptime_check with path "/usr/local/bin/check_uptime.sh"
    every 2 cycles
    if status != 0 then alert
    alert admin@mail.com

# Check Network
check network eth0 with interface eth0
    if failed link then alert
    if changed link then alert
    if saturation > 80% then alert
    if download > 10 MB/s then alert
    if upload > 10 MB/s then alert

# Disk I/O Monitoring
check device sda with path /
    if read rate > 60 MB/s for 5 cycles then alert
    if write rate > 60 MB/s for 5 cycles then alert

# Network Connectivity Check
check host google-dns with address 8.8.8.8
    every 2 cycles
    if failed ping then alert

# Check CPU Temperature
check program temperature_check with path "/usr/local/bin/check_temp.sh"
    every 20 cycles
    if status != 0 then alert
    alert admin@mail.com

# Monitor Docker containers using custom script
check program docker_check with path "/usr/local/bin/check_docker.sh"
    every 1 cycle
    if status != 0 then alert

# Monitor system log for errors
check file syslog with path /var/log/syslog
    if match "error" then alert

# Include additional configs
include /etc/monit.d/*
Access to the Monit in your browser:
http://IP-ADDRESS-OF-THE-SERVER:2812Conclusion
With this setup, I can rely on my Raspberry Pi 4 even for critical services. Monit gives me peace of mind by acting as a lightweight watchdog that alerts me before problems become disasters.
This configuration is minimal, easy to extend, and keeps your Pi monitored 24/7.


