
Linux Real-Time Performance Metrics
Real-time performance metrics play a crucial role in managing and maintaining server environments. These metrics provide live insights into the behavior and health of a server, enabling administrators to detect issues, optimize resource utilization, and maintain system stability. Key metrics include CPU load, memory usage, disk I/O, network traffic, and process activity.
Introduction
Monitoring system performance is crucial for maintaining the health and efficiency of any IT infrastructure. Tools like htop, atop, nload, and iostat provide invaluable real-time performance metrics, allowing system administrators to diagnose and address issues swiftly. In this article, we’ll explore these tools, their functionalities, and how they can be used to keep your systems running smoothly.
htop: Interactive Process Viewer
htop is an interactive process viewer for Unix systems. It provides a real-time, color-coded display of system processes, CPU, and memory usage, making it easier to understand system performance at a glance compared to the traditional top command.
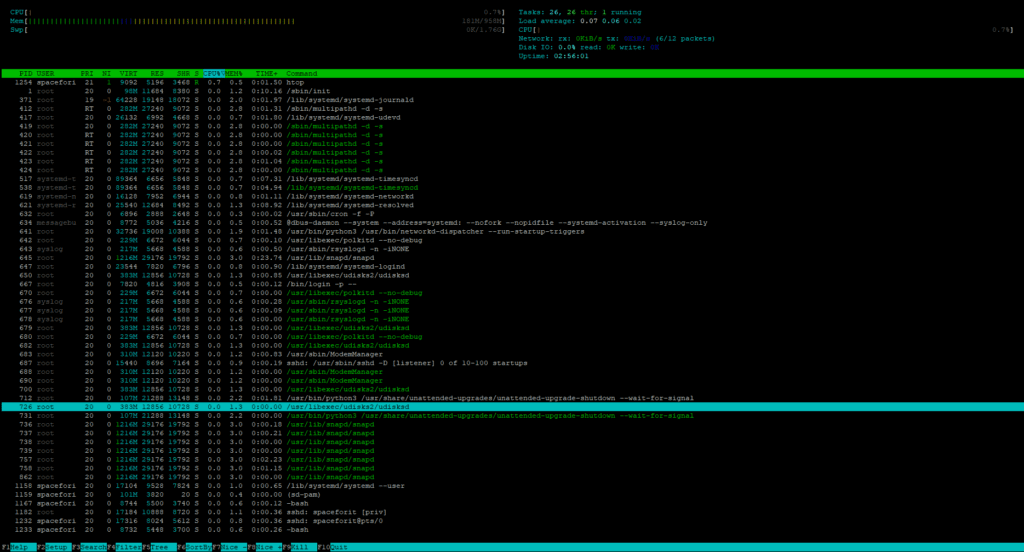
To open a htop type in terminal
htopWith F2 you are able to adapt which parameters needs to be shown in the application:
Key Features
- User-friendly interface: Easy-to-navigate interface with visual aids for quick interpretation.
- Process management: Allows you to manage processes (kill, renice) directly from the interface.
- Customizable display: Users can customize the display to show specific metrics, such as CPU, memory, swap usage, and process tree.
Use Cases
- Identifying processes consuming excessive resources.
- Monitoring system load and memory usage in real-time.
- Diagnosing performance bottlenecks quickly.
Tree View of Processes: htop -t
Shows all processes in a tree structure, helping you understand the parent-child relationship between processes.
htop -t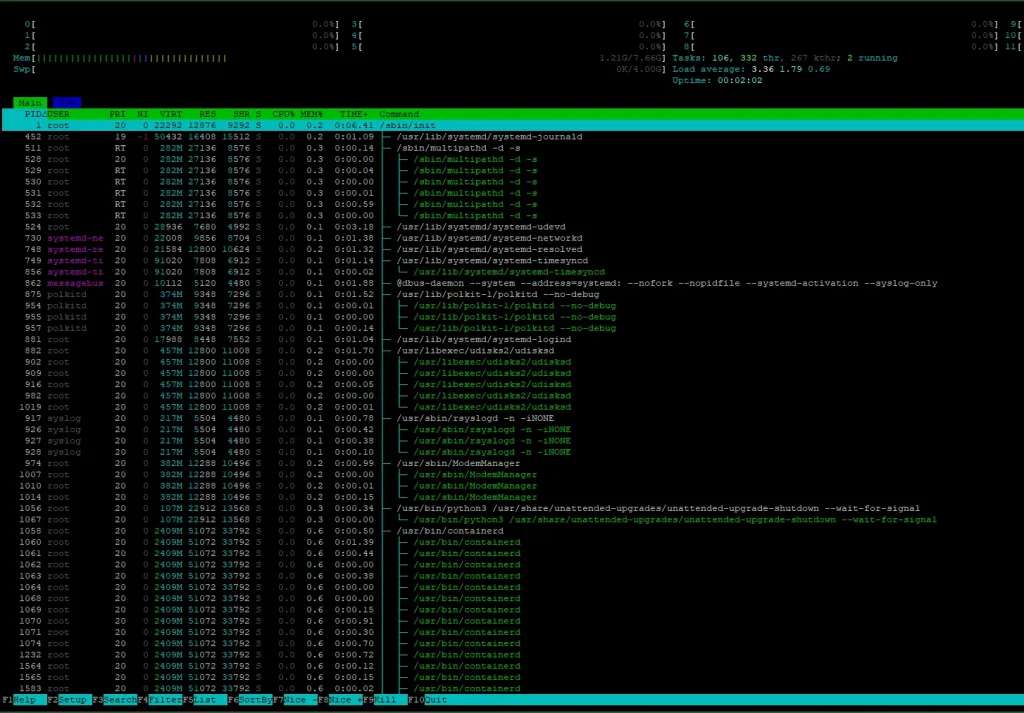
Shows all processes in a tree structure, helping you understand the parent-child relationship between processes.
Filter Processes by Name: htop /
While inside htop, press / and type part of a process name to search.
Example:
/docker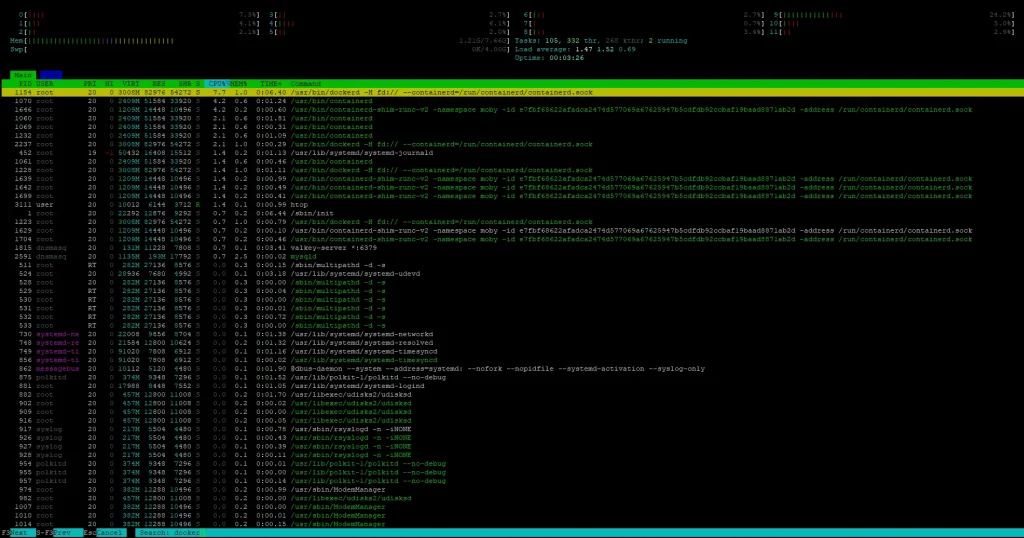
Highlights only the processes matching your filter — useful for isolating services like docker, mysqld, etc.
Kill a Process from htop
Select the process with arrow keys, then press F9 (Kill) and choose the signal (e.g., 15 for TERM or 9 for KILL).
Show Only Processes for a Specific User: htop -u
This displays only the processes belonging to the specified user type:
htop -u username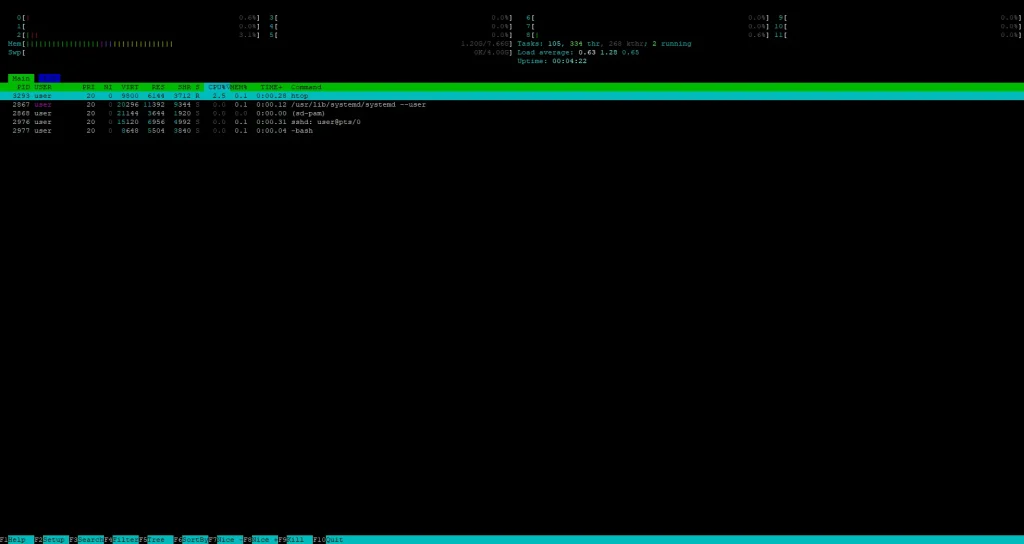
Perfect for debugging processes started by specific user ot web services like Apache or Nginx.
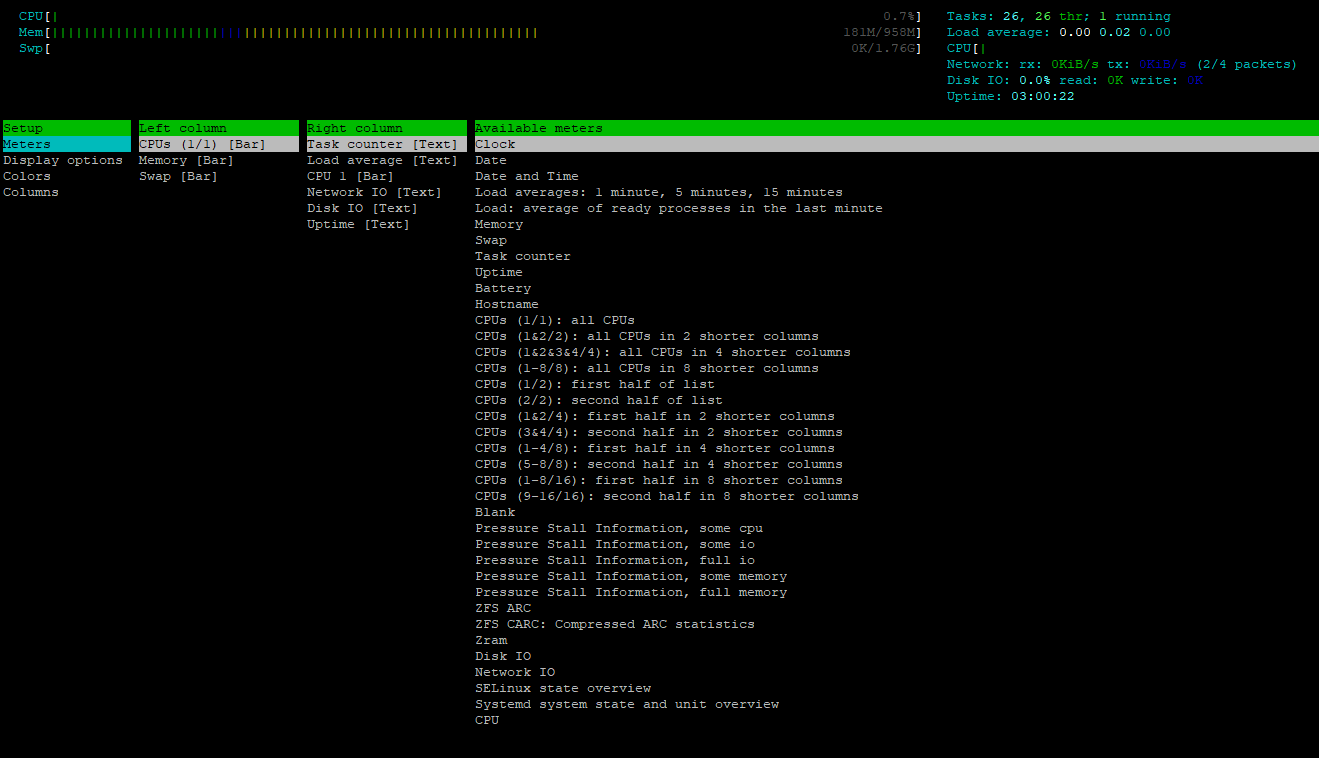
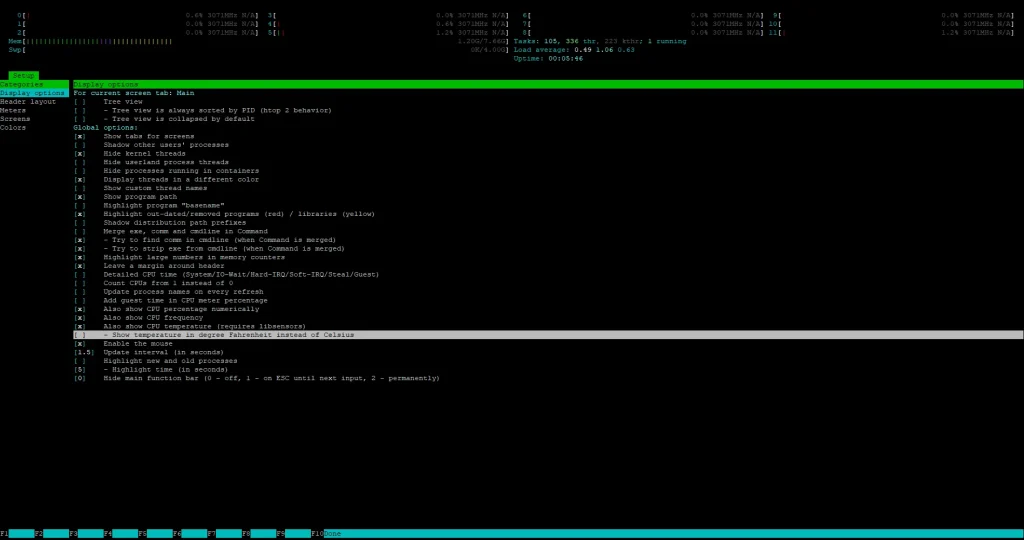
Customize Columns and Meters
Inside htop, press F2 (Setup) → Display options → enable “Command line”.
This helps you see the full path and arguments passed when the process was started — great for debugging custom scripts or cron jobs.
Inside htop, press F2 (Setup) → Columns to add metrics like:
- IO Read Rate
- IO Write Rate
- Disk R/W
- Swap usage
- Nice level
Tip: Add “I/O rate” columns to monitor disk performance alongside CPU/memory.
atop: Advanced System and Process Monitor
atop is a comprehensive monitoring tool that provides detailed insights into system and process-level performance. It goes beyond just showing the current state by logging historical data, making it easier to analyze trends over time.
To install atop application type:
sudo apt install atop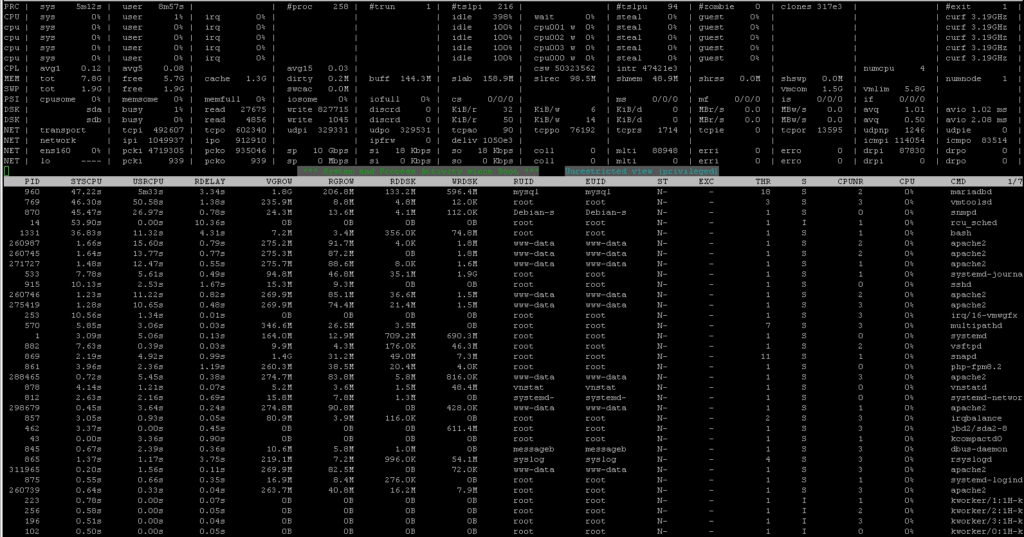
Key Features
- Detailed reports: Displays CPU, memory, disk, and network usage for both individual processes and the overall system.
- Historical data: Logs performance data, allowing for post-mortem analysis.
- Resource accounting: Tracks resource consumption by individual processes, aiding in capacity planning and troubleshooting.
Use Cases
- Long-term performance analysis and capacity planning.
- Troubleshooting intermittent issues by reviewing historical data.
- Comprehensive system monitoring in production environments.
Monitor Disk Activity Only: atop -d
atop -d Filters the output to show only disk-related information (I/O read/write rates, busy time, etc.).
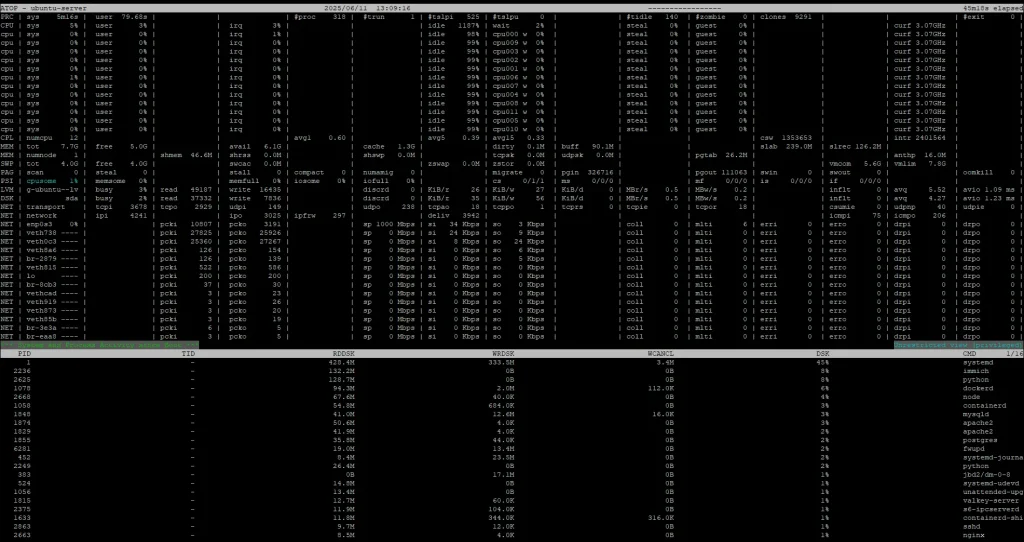
Display Only Active Processes: htop -a
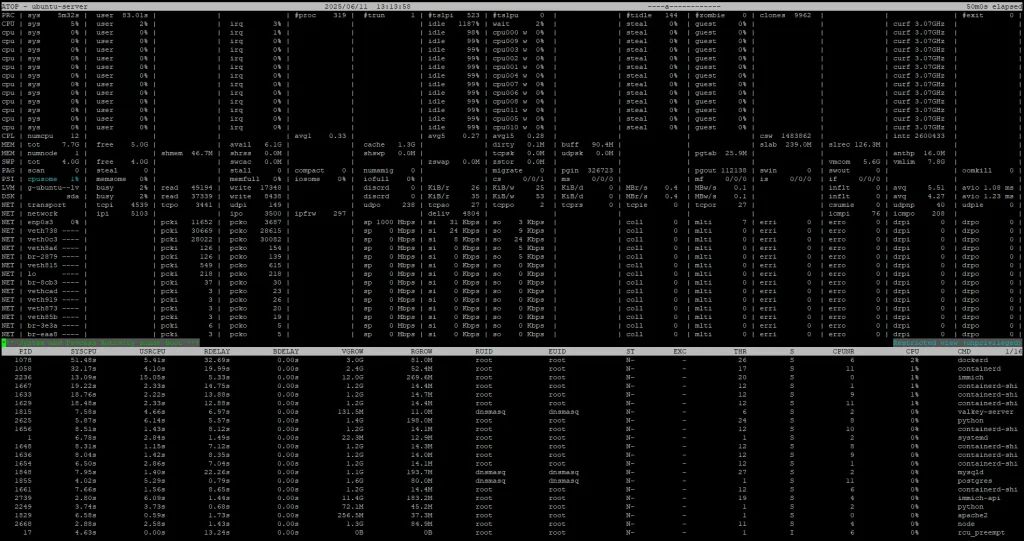
Only shows active processes — those currently using CPU, memory, disk, or network. Cuts down on noise.
nload: Network Load Monitor
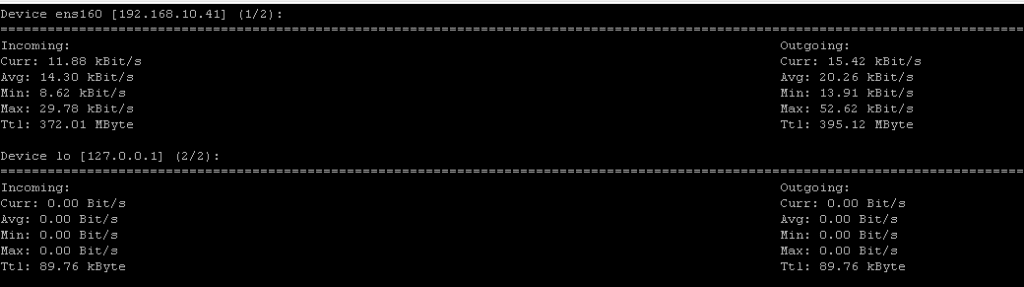
nload is a real-time network traffic and bandwidth usage monitor. It visualizes incoming and outgoing traffic separately, making it an excellent tool for network performance monitoring.
Key Features
- Real-time monitoring: Provides real-time graphs of network usage.
- Traffic analysis: Differentiates between incoming and outgoing traffic.
- User-friendly interface: Simple, console-based interface that is easy to use and interpret.
Use Cases
- Monitoring network bandwidth usage in real-time.
- Identifying network traffic spikes and potential bottlenecks.
- Analysing network performance trends over time.
Monitor Default Network Interface: nload
nloadLaunches nload with the default interface (usually the first active one, like eth0 or ens33).
You can also specify interface:
nload eth0Disable Graph and Show Only Numbers
nload -a 0 eth0-a 0: disables the average bandwidth graph
Minimalist view with just the essential data — helpful for scripting or logging.
Run nload for a Limited Time
timeout 60 nload eth0Runs nload for 60 seconds, then exits. Useful for automation or testing bandwidth during specific periods.
iostat: Input/Output Statistics
iostat is part of the sysstat package and provides detailed statistics on I/O device load. It helps in identifying performance issues related to disk and network I/O by reporting CPU statistics and device utilization.
To install iostat application type:
apt install sysstat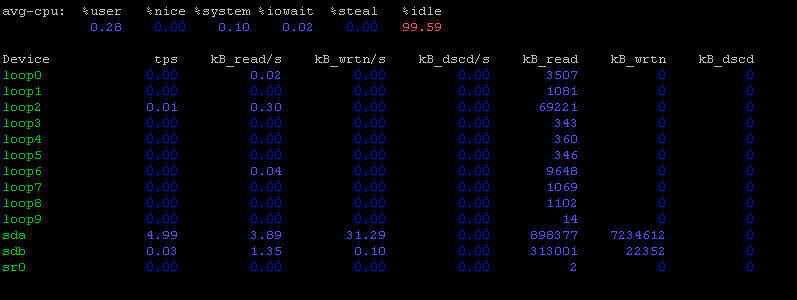
Key Features
- I/O statistics: Detailed reports on disk and network I/O.
- CPU usage: Provides insights into CPU usage related to I/O operations.
- Historical data: Can be combined with tools like sar to collect historical data for in-depth analysis.
Use Cases
- Diagnosing disk I/O bottlenecks and performance issues.
- Monitoring CPU load due to I/O operations.
- Historical analysis of I/O performance trends.
Monitor Disk I/O with iostat
iostat -dx 2 3-d: show device utilization-x: show extended stats (await, util, etc.)2 3: report every 2 seconds, 3 times
Helps you identify if a disk is under heavy load or has high I/O wait.
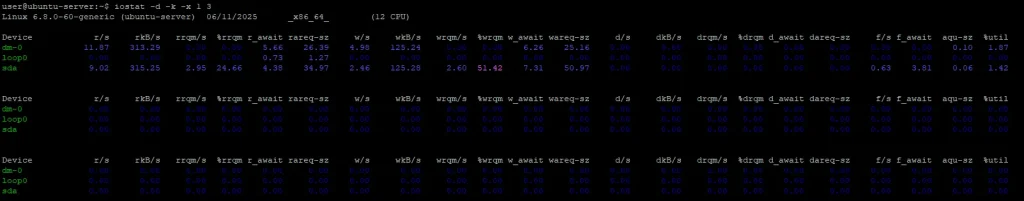
Show All Statistics: CPU, Device, and Partition
iostat -d -k -x 1 3-d: device usage-k: report in kilobytes-x: extended stats1 3: update every second, 3 times
Ideal for detailed diagnosis under stress or load testing.
Get CPU and Disk Stats Every 2 Seconds: iostat 2
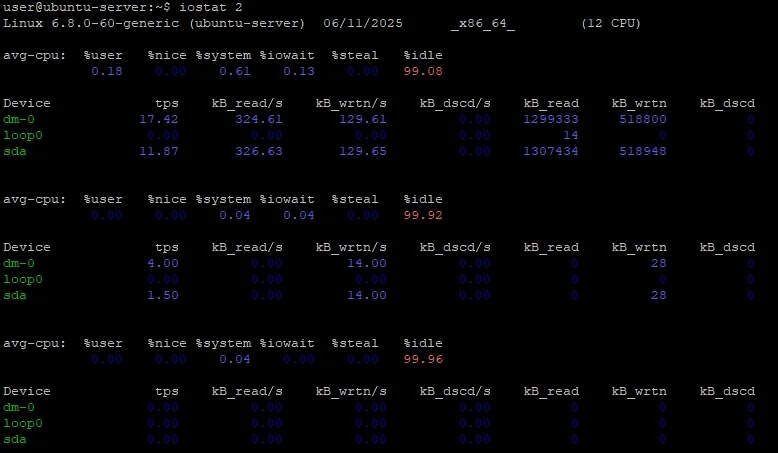
Displays CPU usage and disk I/O every 2 seconds (until interrupted with Ctrl+C). Great for real-time monitoring of performance trends.
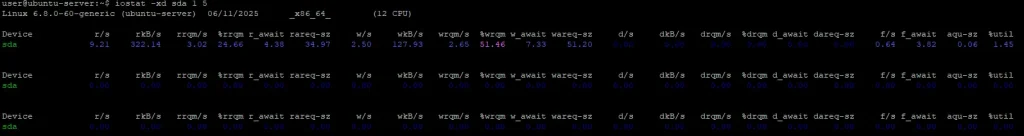
Monitor a Specific Device (e.g., sda)
iostat -xd sda 1 5-x: extended info-d: device reportsda: monitor onlysda1 5: update every 1 second, 5 times
View CPU-Only Statistics
iostat -c 1 5-c: display only CPU stats1 5: every second, 5 times
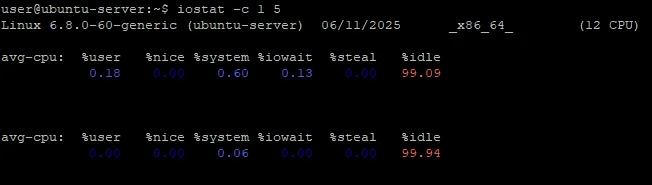
Helps isolate CPU performance without disk data noise.


