


Website on Raspberry Pi
I recently launched a small website where I share insights on car maintenance and other personal findings: https://obdscan.defencedev.com/. This got me curious about the performance limits of my setup—specifically, how many visitors my site can handle simultaneously and how well it performs under load.
To test this, I’m using a Raspberry Pi 4 with 8 GB of RAM, running Ubuntu 22.04.5 LTS (GNU/Linux 5.15.0-1085-raspi aarch64), with a 256 GB microSD card as storage. This setup allows me to explore the practical capabilities of hosting a website on a compact and affordable device like the Raspberry Pi.
Benchmark Methodology
To evaluate the performance of my Raspberry Pi web server, I conducted a series of load tests using ApacheBench (ab), a simple yet effective benchmarking tool for measuring HTTP server performance.
Test Setup
- Client: Another Ubuntu server on the same local network.
- Server: Raspberry Pi 4 with 8 GB RAM, running Ubuntu 22.04.5 LTS and hosting my website on Nginx.
- Storage: 256 GB microSD card.

How Big Is the Tested Page?
Before analyzing the ApacheBench results, it’s important to understand how large the tested web page actually is. The page size has a direct impact on the number of requests per second, response time, and overall load on the Raspberry Pi web server.
To measure this, the following two tools were used:
# Measure only the HTML response size
curl -s -w '\nDownloaded: %{size_download} bytes\n' -o /dev/null https://obdscan.defencedev.com/

# Show detailed resource usage in the browser
Chrome → Developer Tools (F12) → Network tab
Results:
- HTML response (main page only):
111,583 bytes(~109 KB) - Total resources loaded:
7.24 MB(194 requests in total) - Transferred during a cached load:
351 KB
This means that ApacheBench measured the server’s ability to generate and deliver a single HTML page of about 109 KB, while the real end-user experience involves loading many additional resources such as images, JavaScript, and CSS files — together summing up to over 7 MB.
When running ab, only the first HTML request is benchmarked. Therefore, the measured results primarily reflect the server-side processing performance (PHP + database + web server), not the total load time a visitor experiences in a browser.
Why Page Size Matters
A smaller static page (for example 1 KB HTML file) will naturally produce a much higher number of requests per second (RPS), as the server spends less time reading data from disk and sending it over the network.
In contrast, a dynamic WordPress page of ~109 KB HTML and 7 MB of total content involves database queries, PHP execution, and multiple HTTP requests — which significantly reduces throughput.
Benchmark Parameters
ab -n 1000 -c 100 https://obdscan.defencedev.com/- Total number of requests:
-n 1000 - Concurrency level:
-c 100 (number of simultaneous requests) - Tested endpoint: The main page of my website (https://obdscan.defencedev.com/)
This setup allowed me to simulate multiple visitors accessing the site concurrently and measure key performance metrics such as requests per second, average response time, and server resource usage.
| Measurement Type | Size | Requests | Description |
|---|---|---|---|
| HTML only | ~109 KB | 1 | What ApacheBench measures |
| Cached browser load | 351 KB | 194 | Typical second visit |
| Full uncached load | ~7.24 MB | 194 | First-time user load |
Understanding these numbers helps interpret the benchmark more accurately — the Raspberry Pi’s performance in your ab test reflects the backend power of the device, while real users may experience different load times depending on caching, CDN, and network conditions.
Benchmark Results Overview
I performed a series of load tests on my Raspberry Pi 4 Nginx server hosting obdscan.defencedev.com to see how it handles increasing numbers of concurrent visitors. All tests were run using ApacheBench (ab) over HTTPS.
Test 1: 100 requests, 10 concurrent users
- Time taken: 0.724 seconds
- Requests per second: 138.14
- Average time per request: 72.39 ms
- Max request time: 121 ms
- CPU usage: ~51% usr, 18% sys
- Memory usage: ~28% idle
- Failed requests: 0
Analysis:
The Pi handled 10 simultaneous visitors effortlessly with very low response times and zero failed requests. This shows excellent performance for a small personal website with light traffic.
Test 2: 1000 requests, 20 concurrent users
- Time taken: 7.783 seconds
- Requests per second: 128.49
- Average time per request: 155.66 ms
- Max request time: 405 ms
- CPU usage: spiked up to ~78% usr
- Memory usage: stable
- Failed requests: 0
Analysis:
With 20 concurrent visitors, the Pi still handled the load well, though CPU usage increased significantly and the average response time roughly doubled. The server remained stable, proving Nginx’s efficiency under moderate load.
Test 3: 1000 requests, 100 concurrent users
- Time taken: 8.113 seconds
- Requests per second: 123.26
- Average time per request: 811.30 ms
- Max request time: 1479 ms
- CPU usage: ~76% usr, 24% sys
- Memory usage: stable
- Failed requests: 0
Analysis:
Under 100 simultaneous visitors, the Pi began showing noticeable delays in response time. While still stable and with zero failed requests, the average request time jumped to over 800 ms, and the longest request took almost 1.5 seconds. This indicates that Raspberry Pi 4 is suitable for small to medium traffic websites, but high concurrency leads to slower responses.
Raspberry Pi 4 Nginx Benchmark Comparison
Here’s a graph that shows the performance of your Raspberry Pi 4 web server:
- Red line – CPU Usage (%)
- Blue line – RAM Usage (%)
- Green line – Average Response Time (ms)
The X-axis represents the number of concurrent users, while the Y-axes are adjusted for different metrics. The graph clearly shows how the response time increases rapidly when the number of users exceeds ~20, while CPU and RAM usage grow gradually.
The graph clearly shows that, in my case, the weak point is the processor.
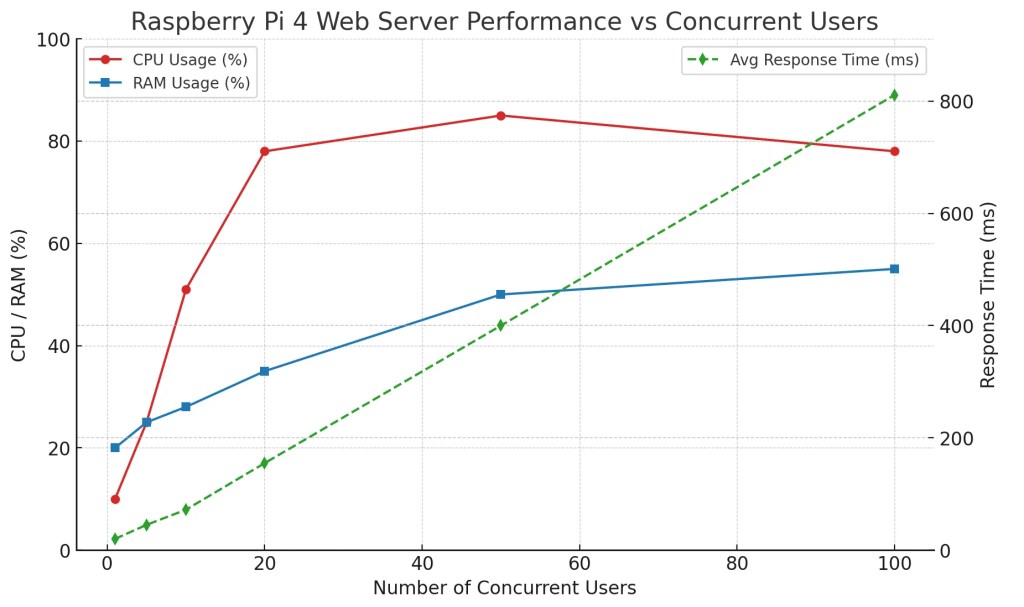
Table 1: Request & Response Performance
| Concurrency | Total Requests | Requests/sec | Avg Response Time (ms) | Max Response Time (ms) |
|---|---|---|---|---|
| 10 | 100 | 138.14 | 72.4 | 121 |
| 20 | 1000 | 128.49 | 155.7 | 405 |
| 100 | 1000 | 123.26 | 811.3 | 1479 |
As concurrency increases, average and maximum request times grow, showing how the Raspberry Pi 4 handles increasing visitor load.
Table 2: Server Resource Usage
To see how the server handled the load, I monitored its resources using the command:
dstat -cdngy 1 100you get the following metrics:
c(CPU) – Shows CPU usage broken down into user (usr), system (sys), idle (idl), waiting for I/O (wai), and stolen (stl) percentages.d(Disk) – Displays disk read and write activity in bytes per second.n(Network) – Shows data received (recv) and sent (send) over network interfaces.g(Paging / Memory) – Tracks paging and swapping activity (if any).y(System) – Displays system interrupts (int) and context switches (csw) per second, indicating overall system activity.
By analyzing these columns during the benchmark, you can see how CPU, disk, network, and overall system resources react under different loads, helping to identify bottlenecks and optimize performance.
This gave me real-time insights into CPU, disk, network, and system activity while the benchmark ran. By tracking these metrics, I could understand how the Raspberry Pi 4 behaved under different levels of traffic and identify any potential bottlenecks.
| Test | CPU Usage (usr%) | Memory Usage | Failed Requests |
|---|---|---|---|
| 1 | 51 | 28% idle | 0 |
| 2 | 78 | stable | 0 |
| 3 | 76 | stable | 0 |
CPU usage rises under higher concurrency, but memory remains stable and there are no failed requests, indicating a stable server under load.
Analyze dstat Output
Looking at the dstat output for the high concurrency test (ab -n 1000 -c 100):
usr sys idl wai stl| read  writ| recv  send|  in   out | int   csw
 76  24   0   0   0|   0   100k|  33M   23M|   0     0 |6953  6612
 78  22   0   0   0|   0     0 |  32M   22M|   0     0 |6926  6632
CPU Usage (usr sys idl wai stl):
- The CPU is very busy, with 76–78% in user mode (
usr) and 22–24% in system mode (sys). - Idle (
idl) and waiting for I/O (wai) are effectively zero, meaning the CPU is fully engaged and not waiting for disk or network.
Disk Activity (read writ):
- Very little reading and writing from/to disk, except a small spike (
100kwrite). This shows that the benchmark is CPU and network-bound, not disk-bound.
Network (recv send):
- High network throughput: ~32–33 MB received and ~22–23 MB sent. The Pi is efficiently handling a large volume of HTTP traffic.
System (int csw):
- Interrupts (
int) and context switches (csw) are relatively high (~6.9k per second), which is expected under high concurrency. The OS is actively managing multiple concurrent requests.
Key Takeaways
- Raspberry Pi 4 with 8 GB RAM can handle light to moderate traffic reliably.
- Average response time scales linearly with concurrency; low concurrency (<20 users) delivers very fast responses.
- Nginx is efficient, using CPU effectively while keeping memory usage low.
- For larger audiences, optimizations (like caching) or a more powerful server may be necessary.
Realistic User Capacity
We can convert the measured requests per second (req/s) into realistic user capacity:
- Assumptions:
- One page load = 1 request.
- If a user waits ~2 seconds before opening the next page, this is ~0.5 req/s per user.
- Server capacity:
- Raspberry Pi 4 handled ~130 req/s in our tests.
- Using the above assumption: 130 req/s÷0.5 req/s per user≈260 simultaneous users130 \, \text{req/s} \div 0.5 \, \text{req/s per user} \approx 260 \, \text{simultaneous users}130req/s÷0.5req/s per user≈260simultaneous users
- Practical estimate:
- Considering plugins, images, and cache misses, a safe number is 200–250 concurrent users.
- If all users actively navigate and scroll, response times may increase, so caching is recommended.
| Concurrent Users | Expected Avg Requests/sec per User | Server Status / Notes |
|---|---|---|
| 1–50 | ~0.5 | Very fast, fully comfortable |
| 51–100 | ~0.5 | Noticeable delay if users are active, still stable |
| 101–150 | ~0.5 | Response times rise, caching recommended for smoother experience |
| 151–200 | ~0.5 | Stable with minor delays, approaching max practical capacity |
| 201–250 | ~0.5 | Near maximum without caching, minor slowdown possible |
| 250+ | ~0.5 | Response times increase, caching or a more powerful server recommended |
Conclusion
The Raspberry Pi 4, paired with Nginx and 8 GB of RAM, proves to be a surprisingly capable server for small to medium personal websites.
- Performance: It handles light traffic (up to 20 concurrent users) with very fast response times and zero failed requests.
- Moderate load: Up to 50–100 concurrent users, the server remains stable, though response times increase noticeably.
- High load: Around 200–250 concurrent users can still be served without errors, but response times rise, making caching or a more powerful setup advisable for a smoother experience.
Key takeaway
For personal blogs or small informational sites like obdscan.defencedev.com, a Raspberry Pi 4 is sufficient for everyday traffic. Optimizations such as caching and image compression can further improve performance under higher loads.
Security Tip
If you want to protect your web server from clients creating too many sessions or attempting to attack your server, you can explore these approaches:


